Digital Experience Platform Module
See the guest journey, not just the sales report.
Heat maps, menu performance, and table utilization — the operational analytics that turn a floor plan into a growth strategy.
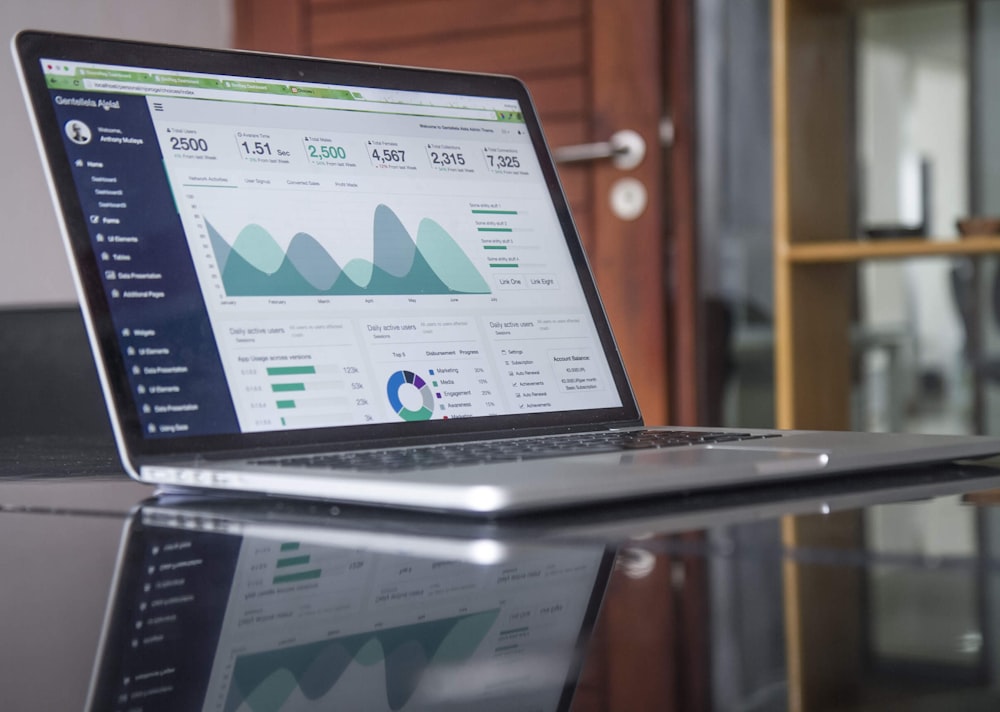
The Shift
Instead of a sales report that shows what was sold, this shows how it happened — where guests sit, how long they stay, what they order together, and where the next margin opportunity is hiding.
Full Feature Set
What's included
Guest journey mapping through the venue
Physical heat maps of guest movement and dwell time
Menu performance analysis
Popular item combination analysis
Upselling opportunity identification
Table utilization and turnover analysis
Peak-hour and daypart analysis
Customer lifetime value visualization
Pricing
Choose your tier
Exact pricing is quote-based — starting rates available once you tell us more about your venue.
Starter
Menu and timing insights.- Menu performance analysis
- Peak-hour analysis
Growth
Full operational analytics.- Everything in Starter
- Table utilization
- Combination analysis
- Upselling opportunity flags
Enterprise
Physical and cross-location analytics.- Everything in Growth
- Physical heat-mapping
- Cross-location benchmarking
- Custom analytics builds
Ideal for
Venues wanting to optimize layout, staffing, and menu design based on evidence rather than assumption.